Linear Graphs Investigations and Difficulty they May pose to Students
By
Cassian Mosha
Graph the following on the same set of axes

Make observations. Think about the difference, for students, or graphing all at once, versus adding one equation and graph at a time.
We will plot all the graphs in a single set of axis and explore what is happening as we plot one graph after the other. Basically these will be linear graphs with different x and y-intercepts. Let's graph the first equaton.

Figure 1 f(x)=x+4
As seen in figure 1 the graph of y=x+4 is a linear graph with x-intercept at (-4,0) and a y-intercept at (0.4). It is a straight line ascending from the second quadrant to the first quadrant, and it has a positive slope. For student such a single graph will be easy for them to draw and interprete, but what will happen if they have to draw nine of the same or different graphs at one time? This is the question we want to explore and see how and what we should do to make sure they can handle it well. Let's now graph the rest of the equations to see what kind of graphs they represent and try to answer the question we are trying to explore.

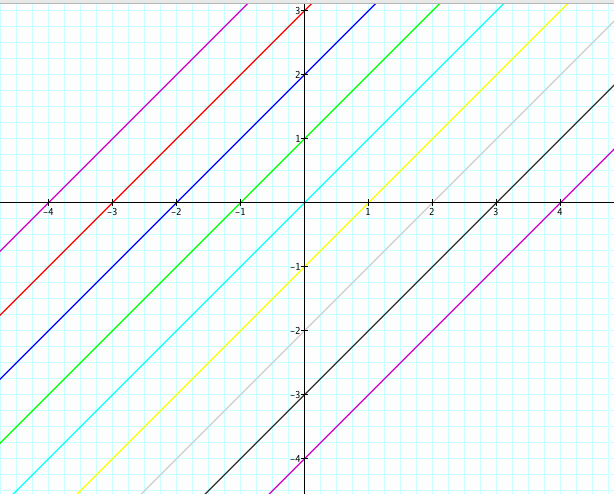
Figure 2 f(x)= all expressions above
As we can see all graphs are linear graphs, and the slopes are positive (by observation/slope equation) and the intercepts are different but with alternating signs. For example for the equation f(x)=x+4, the x-intercept is (-4,0) while its y-intercept is (0,4). X is negative and Y is positive. If you look at the expression f(x) =x+(-4), the x-intercept is (4,0), and the y-intercept is (0, -4). This is exactly the opposite of the previous expression we discussed, and this might cause a lot of confusion to students. The rest of the expressions will follow the same pattern. By observation also we can conclude that all lines are parallel snce they all have the same slope. This can also be proved by usng the slope equation, the change in y versus change in x.
The difference students might experience in graphing all at ones versus one at a time is that graphing one at a time and write about the bevavior of the graph might be easy since students will be comparing only one graph and they can pick up all the intercepts and the behavior of the graph easliy. Graphing all at once might create a multitask issue and probably some stidents may not be able to handle it. Apart from this, here are some few more issues the students may encounter if all plot at once versus one at a time:
1) Complication about the relationship between x and y
2) Errors in pointing out the intercepts
3) Confusion in determining the parameters such as slope
4) Dependent/independent variable issue
5) Difficulty in set of quantites to be measured using the equations
6) Because of the clustte of the graphs may make interpretation issue difficult.
7) Picturial representation one by one make analysis easy, that is comparing and contrasting